📊 The Analyst’s Toolkit I.
Kicking off my Analyst’s Toolkit series, I have to start with my first “best friend”: Tableau Public.
But before I tell you why I love it, I have to tell you how I found it.
My Catalyst for BI
My journey into Business Intelligence started with a struggle. Back when I was working at Intrum, our tool of choice was QlikSense. For about a year, I fought with it — trying to bend the data to my will, building complex calculations, and constantly feeling limited by the tool rather than empowered by it.
That frustration became my motivation. I knew there had to be other ways to visualize data, so I started exploring Tableau on my own time. That curiosity changed my career. Soon after, I joined Starschema, where I had the absolute luxury of working alongside some of the best data analysts in Hungary. Seeing what the pros could do with Tableau was a revelation — it was like seeing fire for the first time.
More Than Just a Free Tool
If you think Tableau Public is just a “lite” version of the professional software, you’re missing the point. It is the most powerful career-building platform in the data world.
Steal with Pride (The Analyst’s Secret)
In the corporate world, we call it “benchmarking.” On Tableau Public, I call it Steal with Pride. One of the best features of the platform is the ability to “open the hood” — you can download any public workbook and see exactly how the world’s best developers structured their containers, built their calculated fields, and achieved that clean “SaaS” look.
A great place to start: search for Viz of the Day picks and download the ones that impress you. Reverse-engineer them. That’s how you level up faster than any course can teach you.
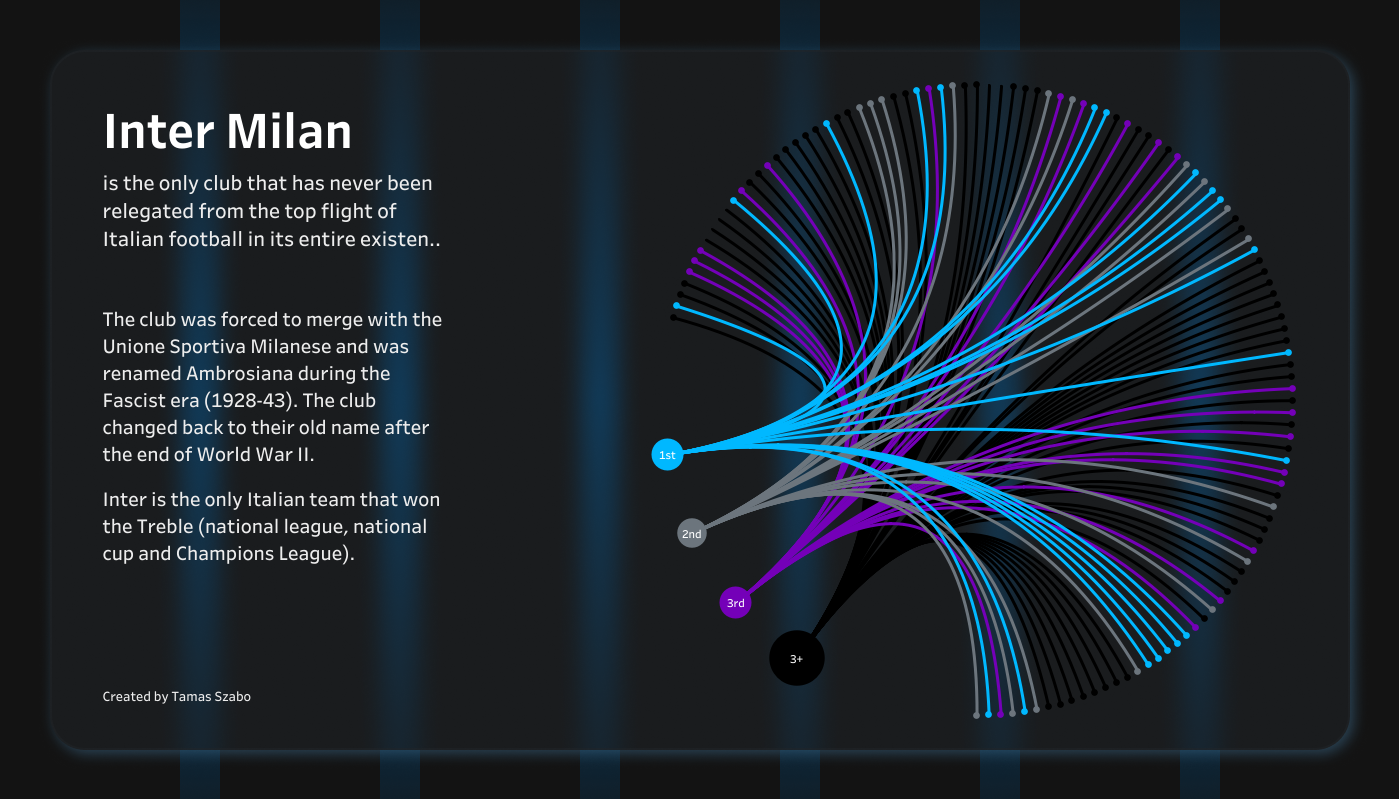
My Work in Action: The Nerazzurri Success
To show you what this looks like in practice, I stepped away from corporate KPIs and focused on a lifelong passion: Inter Milan.
Being a massive Nerazzurri fan, I wanted to showcase the club’s recent success through a professional lens — applying the same executive-style clarity I use at Hyundai to the Beautiful Game. It’s one thing to say Inter is successful; it’s another to see the data prove it.
Learn from the Masters
I didn’t reach Senior level by guessing. I stood on the shoulders of giants. If you want to level up, these three resources are non-negotiable:
The Takeaway: Just Do It
The biggest lesson I learned from my time at Starschema and my transition to international roles is this: you can only learn this by doing. Stop watching. Start clicking.
Just do it.
Up Next in the Toolkit Series
How I use Figma to design dashboards before I ever open Tableau — and why it changes everything.
Read Part II: Figma →